Sophia Nickloy
Portfolio
Cartography
Introduction to GIS
Applications
Programming
Remote Sensing
Special Topics
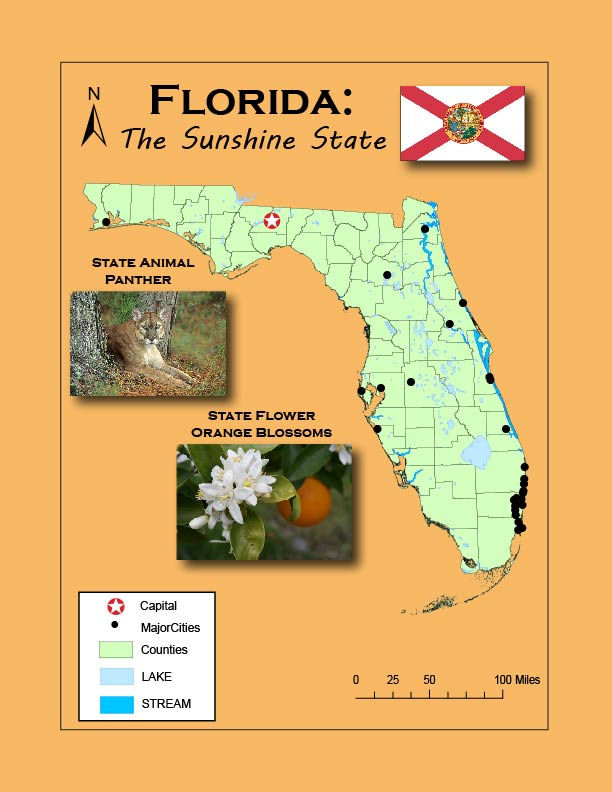
This map showing the state of Florida was created using both ArcMap and Adobe Illustrator. The state counties, major cities, and surface water shapefiles were added within ArcMap. Using Adobe Illustrator, the state flag, animal, and flower were imported and placed accordingly.

This map displays the elevation throughout Mexico utilizing a raster Digital Elevation Model (DEM). It uses a stretched continuous flow color scheme. This starts with dark green as the lows, moving to light green, yellow, and ending with red highlighting the peaks in the country. This layout also maintains an inset map highlighting Mexico and the focus area again.

This map focuses on tsunami evacuation zones in Japan. In ArcMap, the Multiple Ring Buffer tool was used to create the Nuclear Evacuation Zones. The enlarged inset map provides a look at the coastline as well as the tsunami evacuation zones.

This map leveraged Gestalt's Principles of Visual Hierarchy, Contrast, Figure Ground, and Balance. The product displays the Public Schools in Ward 7, Washington D.C.

Displaying the best possible campground sites in De Soto National Forest Mississippi, this map was created using the Buffer, Overlay, and Attribute Selection tools found within ArcMap. The map highlights all of the possible campground sites based on the criteria shown on the right.

This analysis displays crime density categorized by burglary, sexual abuse, and homicide within Washington D.C. The maps were created using the Kernel Density tool within ArcMap.
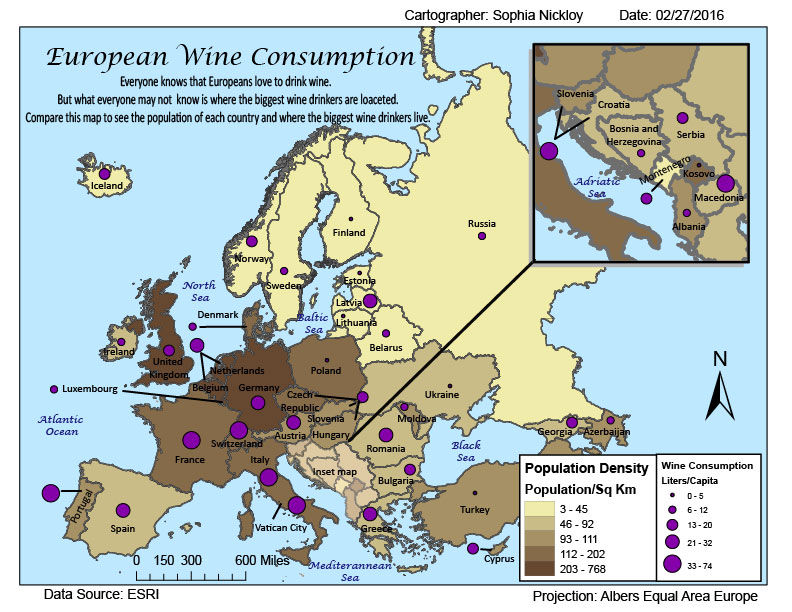
The task for this assignment was to create a choropleth map using either proportional or graduated symbols. Graduated symbols were used to better depict the population of Europeans and their wine consumption. This map was created using both ArcMap and Adobe Illustrator.

Screenshot of a Model Builder created within ArcMap. This model was created following a tutorial exercise by ESRI, with the model helping locate suitable sites for a treatment facility. The model includes input data, output data, and tools such as Buffer and Append.
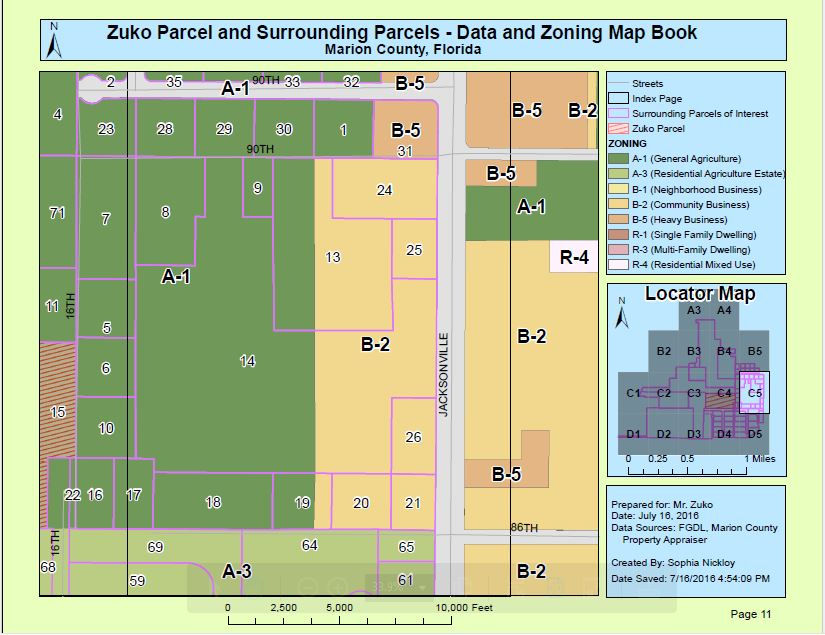
The objective for this map was to provide information regarding a specific parcel for the client, Mr. Zuko. Upon the client's request, a data and zoning map book was created. Shown above is only one of the 16 pages containing the parcels. The map displays different zones broken down by color, making it easier to comprehend. Mr. Zuko's parcel can be seen on the left side of the map - shown in the red, diagonal lines. The surrounding parcels of interest are outlined in purple.

The proper use of variables, strings, lists, functions, and methods were all learned within Python upon the completion of this assignment. Using everything learned in the exercise, I was able to print my last name, assign a variable containing the letters that form my last name, and assign another variable that allowed me to multiply the letters in my last name by three. The image shown above is a screenshot displaying the results.

The map displayed focuses on two specific criteria: texture and tone. Tone can be described as the brightness or darkness of an area, while texture is how smooth or rough the surface appears. Five uniform areas were chosen to cover the range of both tone and texture of the given aerial photograph. The tonal areas range from very light, light, medium, dark, and very dark; whereas the textural areas range from very fine, fine, mottled, coarse, and very coarse.
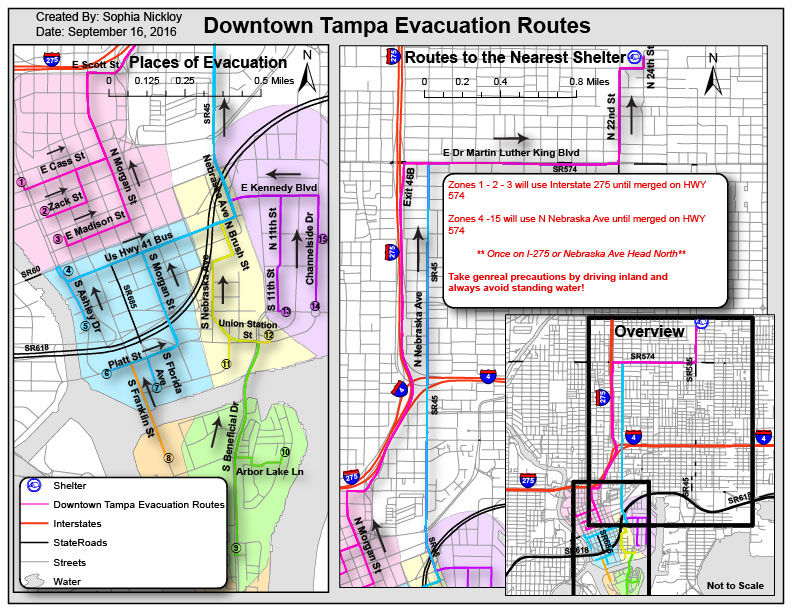
This product displays multiple evacuation routes from downtown Tampa to the nearest local shelter in preparation for Hurricane Matthew. Close up images of the routes are provided, as well as an inset map displaying the full route. Text advises drivers on general precautions. Using Network Analysis and Adobe Illustrator, routes were created from 15 zones to the shelter. Color codes help the public determine the recommended route.
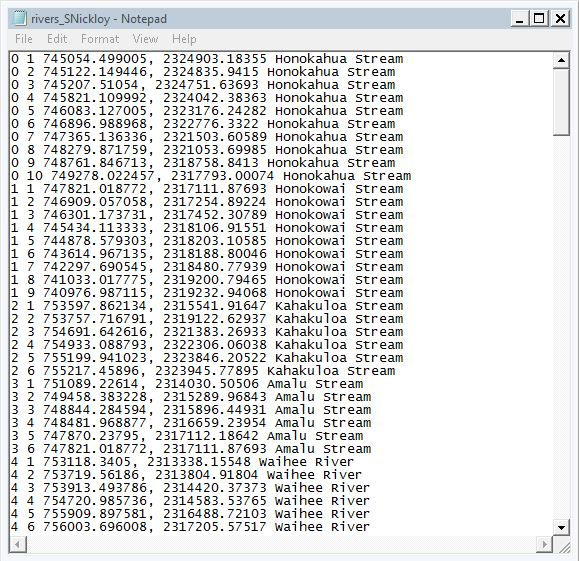
This is a screenshot of a text file showing the results from creating multiple "for loops". In the process of creating this text file, a search cursor was created for the rivers shapefile provided. The first for loop created iterated through each row/feature in the shapefile's attribute table. Within the row for loop, another loop was created which iterated through each point in the array of the row/feature.

The creation of this map focused on the classifications and codes of land use and land cover. Land use refers to how land is being used by humans, whereas land cover refers to the biophysical materials found on the land. This map was created using the Draw Polygon tool within ArcMap. Polygons were drawn around all of the different classifications and were labeled accordingly with the correct codes, which can be seen on the right.
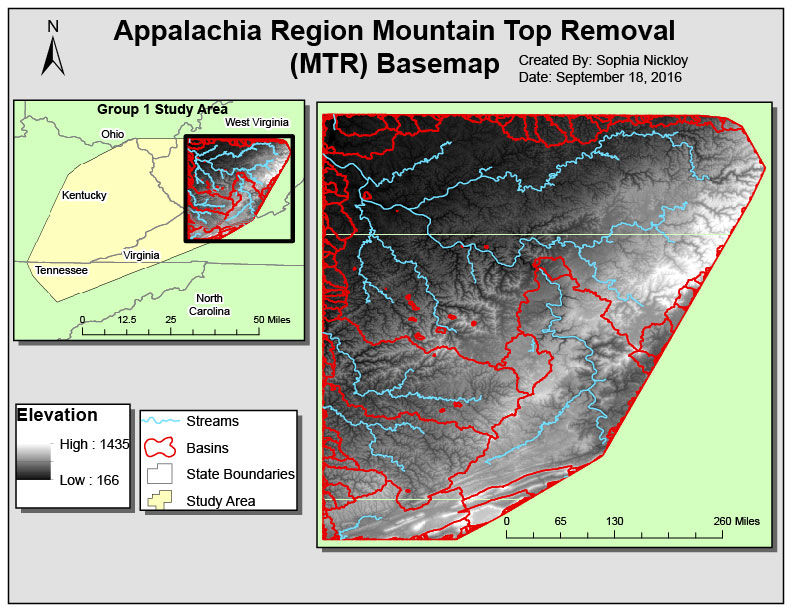
The basemap above provides an overview of the study area and displays the digital elevation model (DEM), streams, and basin. Utilizing skills and tools learned within ArcMap, a mosaic raster was created out of four DEM sections, which was then clipped to the study area. From there, multiple tools were applied to the mosaic to generate the streams and basins.
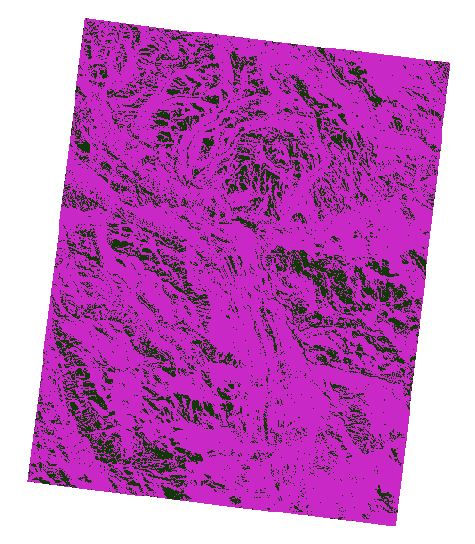
Raster files are images that are used in ArcMap. Python can be used to describe components of a raster file, to remap and reclassify land cover, and to classify slope and aspect. The most commonly used extension in working with raster files is the Spatial Analyst extension. Within Python, the arcpy.sa function is most frequently used. Shown above is the final result of using numerous arcpy.sa functions to remap and reclassify landcover.

A new software, ERDAS Imagine, was utilized to create this map. A variety of tools and functions were learned including how to navigate within the Viewer, how to add a new column in the image attribute table, and how to create a subset from the image provided. The image displays the land cover classifications and their respective areas.

This map was created using Quantum GIS (QGIS), which is a free and open source geographic information system (GIS) application that provides data viewing, editing, and analysis. The map displays overviews for both the food desert and food oasis within Pensacola, FL.


